Once you've chosen a place and dates, the Project Planner gets every day's weather from a weather service. This page covers how to look through it, group it by week, fix days that look wrong, and bring in your own.
Get the Weather
Press Get Weather Data under your locations. The button is ready once every location has a place chosen from the list and dates that work. For each day you get the high, average and low temperature, rain, snow, daylight (sunrise to sunset) and the phase of the moon.
Saved Weather
A saved project opens with the weather it was saved with. Its days never change unless you choose to change them.
- Check for Updates gets every day again. New days are added, and if any saved day's weather is different now, you choose whether to update those days and whether to add the new ones.
- The newest days are early data at first, and weather sources can update them for about a week. The next time you add new days or Check for Updates, any that changed are shown for you to choose.
A link doesn't hold weather, and a gallery page keeps the weather it was published with (see What a Project Includes).
Check for Updates
For a saved project, the main button on the Location step says Add 14 New Days (with however many are waiting) while a project is still going, or Check for Updates when there are none; the Project menu offers Check for Updates too. It gets every day again. When no saved day is different, the new days are just added. When some are, Update Weather Data opens, and nothing changes until you press its save button, which says what it will do (like Update 5 Days or Keep As Is).
- Add 14 new days: on to start. If you turn it off, the new days are offered again next time.
- Update Past Days: off to start. Weather sources often correct past days as more station reports come in. It says how many days in your project would change color, and which source has newer values. If none would, you'll just see a short note with Review changes.
- Choose which days to update (or Review changes) opens All Changes: every changed day, the new value over the saved one and how much it changed. Filters narrow the list (New color, Now settled, Was missing, Now missing, temperatures or rain and snow that changed by at least an amount, Kept, dates), and Select Shown, Clear Shown and Invert pick the days shown. With Show Colors a changed color shows both ("Color 2 → 3").
- Days you've made (with your progress set) stay as they are, so your project keeps matching your blanket. You can still pick them in All Changes if you want to.
- Kept days: days you don't update keep their saved values, and you won't be asked about them again unless they change again. They're marked in the weather table: tap the mark to see both values and use the new ones.
- Auto ranges don't change. When your weather no longer matches them, the gauge says so, with Update Ranges. If the project has a gallery page, you can update it right after.
What a Project Includes
Saved projects keep their weather, and so do copies opened from a gallery page. Their days only change if you choose Get Weather Data.
A link holds a project's settings but not its weather, so you search for it after opening one. Weather sources sometimes update past days, so they can come out a little different.
To share a project with its weather, share its gallery page.
Weather Sources
Press Source in the toolbar above the weather to choose where it comes from, then get the weather data again. The button shows the source in use, or Custom once you've edited or imported weather.
Open-Meteo
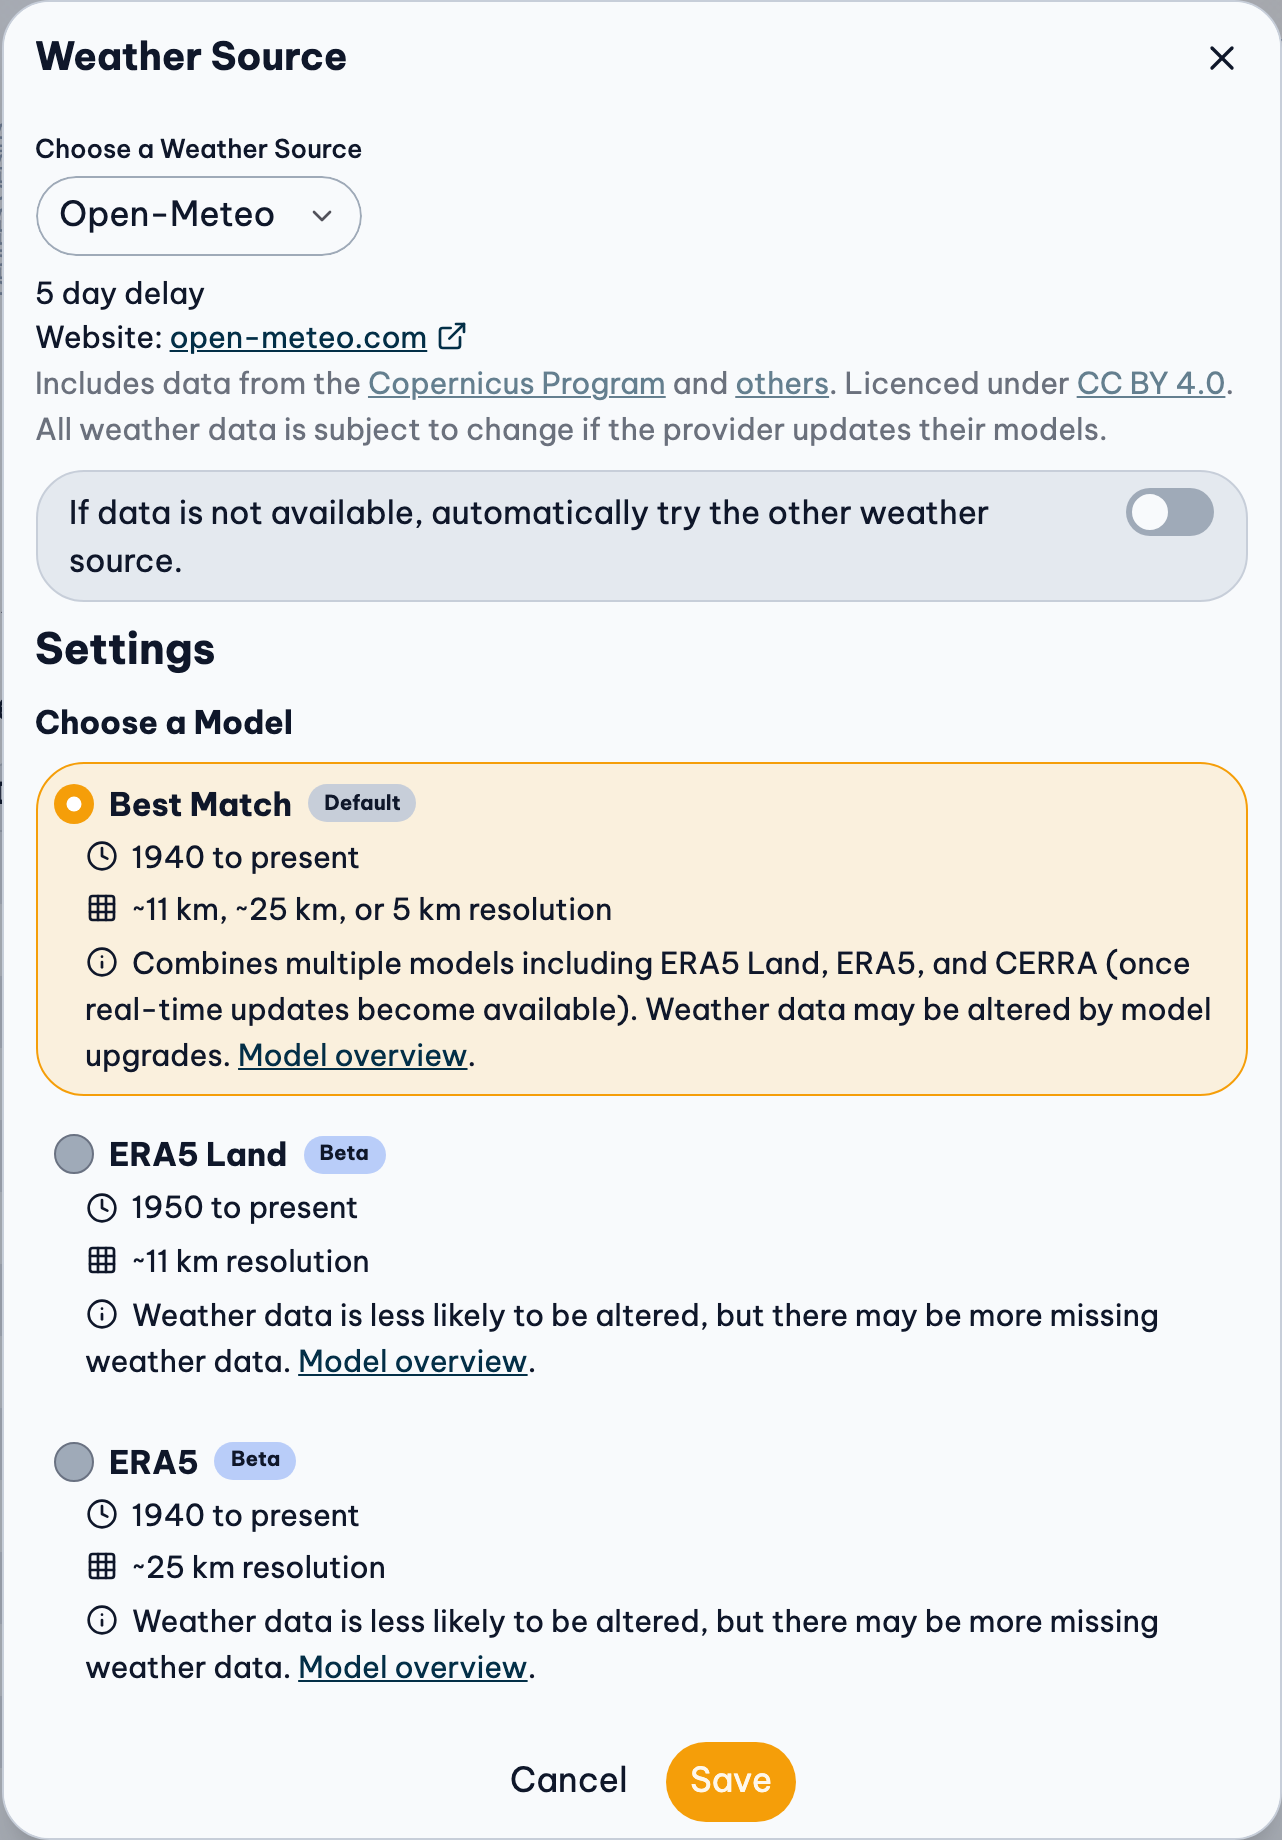
This is the default. It has weather for anywhere in the world going back to 1940, worked out from weather models and observations. Choose a model:
- Best Match (default): 1940 to present, ~11 km, ~25 km, or 5 km resolution. It combines several models, so it's the most complete, but a model upgrade can change past days a little.
- ERA5 Land: 1950 to present, ~11 km resolution. Past days are less likely to change, but some days may be missing.
- ERA5: 1940 to present, ~25 km resolution. Past days are less likely to change, but some days may be missing.
Meteostat
Meteostat combines measurements from real weather stations near your place. Fill Missing Data (on by default) fills days the stations missed with model data. Meteostat's snow is the depth of snow on the ground, not how much fell.
If one source has nothing
With If data is not available, automatically try the other weather source turned on, the Project Planner tries the other source when the first has no weather for your place and dates, and tells you it did.
Weather from any source can change, since services correct past days and upgrade their models. See Data Sources & Credits for the licenses.
Daily or Weekly Weather
Choose Grouping above the weather.
Use the weather of each day, or group the days into weeks for a shorter project.
- Daily: one row or square for each day.
- Weekly: one for each week, starting on the
day chosen in Weeks Start On (in the
Grouping menu). Each week has:
- the highest high temperature of its days,
- the average of their average temperatures,
- the lowest low temperature,
- all their rain and snow added together,
- and their average daylight.
The averages shown above the weather chart can be a little different for daily and weekly weather. That's expected, since one is worked out from days and the other from weeks.
Editing and importing always change days, whichever grouping the table shows.
View the Weather
- Summary: the highest, average and lowest temperatures, total rain and snow, and the average daylight of your whole project, with the date of the hottest and coldest day.
- Chart: every day's weather. To hide or show a value (High, Rain, Moon Phase…) in the chart, the summary and the table, use View › Values above the table.
- Table: every day, one row each. Filters above it narrow the days (Missing, Made, May change, Kept, a date range, a location, or a Color: the days in one of a gauge's colors, in any of its values or just one, like the High). Press a heading to sort by it, or Go to a date. Show Colors puts each value's color beside it ("Color 3"); press a color for its yarn and name. Every weather table (here, Edit Weather Data, the list of changed days, a range's days) has the same filters and colors, and Show Colors is one setting for all of them.
To switch between °C / mm and °F / in, use Units above the weather (or press u). It changes the units everywhere on the site.
Edit the Weather
Press Edit at the top of the Weather step, or press a value in the table to start on it. Edit Weather Data opens every day's weather in a grid, like a spreadsheet. For step-by-step help, see Fix a Few Days.
- Typing: type over a value and press Enter; Enter, Tab and the arrow keys move. Daylight is hours:minutes, like 08:12. Leave a value empty for missing. The moon phase can't be edited.
- Set and Add: for the selected values (drag, or Shift-press), give them all one value, or add a number to each (negative takes away). Delete clears them.
- Paste: cells copied from Excel, Numbers or Google Sheets go from the cell you paste on. Rows that start with dates go to their days.
- Find Missing and Fill In Missing: go to the next empty value, or fill the selected ones (all of them, with one value selected) from the days on either side. They show only while some values are missing.
- Filters: the same as the table's, plus Edited, for the values you've changed.
- Show Colors: each value's color beside it, and the selected value's yarn named above the grid as you type. A changed value shows what it was, crossed out.
- Apply: nothing changes in your project until you press it. Until then, Undo and Redo in the editor work on your changes, Revert puts the selected values back, and closing asks before leaving them. Once applied, Undo above the project takes them back in one step.
Once you've edited the weather
- The weather source shows Custom, and the places and dates are locked so your changes aren't replaced by accident.
- Your weather is saved with the project: in this browser, and in your account when you're signed in.
- A copied link doesn't include it. Whoever opens the link gets the weather from the weather source. To give someone your weather, send them the spreadsheet too.
- To start over with the source's weather, press Get Weather Data on the Location step, then Reload Weather Data. It asks first, because your changes are replaced.
Import Your Own Weather
Use readings from your own thermometer, a local weather station or any other source. Your weather needs to be Daily.
- Press Download at the top of the Weather step, then Download CSV. This is your project's weather as a spreadsheet.
- Open it in Excel, Numbers or Google Sheets, change what you want, and save it as CSV.
- Press Edit, then Import File, and choose the file, or drag it onto the box.
- The values that differ are marked in the grid. Check them, then press Apply.
Rows that can't be read are left out, and listed. You can also skip the file and paste the cells from your spreadsheet straight into Edit Weather Data.
CSV File Requirements
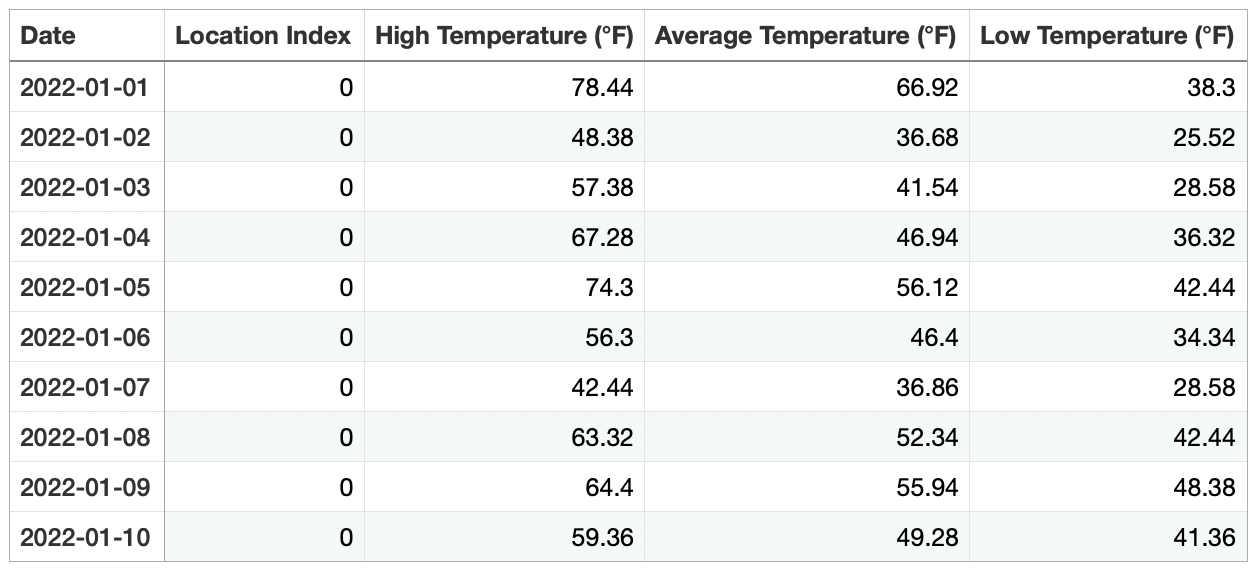
The easiest way is to download your project's weather as a spreadsheet (CSV), change it, and import it back. Choose Daily weather before downloading, because a weekly download has a Week Of column instead of Date, which can't be imported. Any CSV file works, though, if its first row has these headings.
Always:
- Date: written like 2026-03-10. Dates outside your project's dates are left out.
- Location Index: 0 for your first location, 1 for the second, and so on. With one location, it's always 0.
Then any of these, in either units:
- High Temperature (°F) or High Temperature (°C)
- Average Temperature (°F) or Average Temperature (°C)
- Low Temperature (°F) or Low Temperature (°C)
- Rain (in) or Rain (mm)
- Snow (in) or Snow (mm)
- Daytime (h:m), as hours:minutes (08:12 is 8 hours 12 minutes)
Type the headings exactly, with the spaces, brackets and symbols. Weather without a column in your file stays as it is. In the columns you include, don't leave any cells empty, since an empty cell is read as 0. Save the file as UTF-8 if your spreadsheet app asks.
When the Weather Doesn't Look Right
"Something Went Wrong"
The weather service had nothing for your place and dates, or couldn't be reached. Try:
- dates in the past only (not today or later),
- a bigger town or a place nearby,
- the other weather source,
- or again in a few minutes.
Dates Out of Range means the source has no weather that far back (Open-Meteo starts in 1940), and Service Temporarily Unavailable means it's busy: try again shortly.
"There's some missing data"
Some days are missing a value, and it says which. Try another source or model, a place nearby, or fill them in yourself. You can keep going as it is, too.
The newest days change
Weather services can take up to a week to settle the latest days. When your project includes recent days, the Project Planner says so, and once they've settled it suggests Check for Updates. Saved days never change on their own. To be safe, stay about 6 days behind with Open-Meteo, or 8 with Meteostat.
It's different from my thermometer
The weather is for an area around your place, not your garden. What to do when the weather doesn't match.
If something still looks wrong, press Weather Data Feedback under the table to let me know.
Error: Mixed Parameters
Error: Mixed Parameters shows under the snow when your locations get their weather from different sources. Meteostat measures how deep the snow is, and Open-Meteo measures how much fell, so the snow totals mix two different things and won't be accurate.
To fix it, choose Open-Meteo as the weather source for every location. You can keep the mix if you like, but the snow numbers won't mean the same thing for every location.
Related Guides
- Weather Doesn't Match My Thermometer: Why the weather can look wrong or change later, and how to use readings you trust.
- Crochet or Knit Along All Year: Making a blanket for this year, one row a day, and keeping the same project going as the weather comes in.
- Rain, Snow and Sunshine Projects: Projects for rain, snow or daylight instead of temperature, and how their ranges work.